Set 3D Maple plot options
These 3D Maple plot options are:
- Used within the plot statement argument (plotstatement) of the plotmaple command.
- Entered with plot3d at the beginning of the plotstatment argument.
- Entered as equations of the form of option=value after the function(s), horizontal range, and vertical range. Example — plotmaple("plot3d(sin(x)*y, x=-Pi..Pi, y=-1..1, lightmodel=light1)");
IMPORTANT: You can only have 1 set of quotations in your plotmaple function.
Example — $a=plotmaple("plot3d(x^2+y^2, x=-5..5, y=-5..5, axes="normal")"); will give an error.
Example — $a=plotmaple("plot3d(x^2+y^2, x=-5..5, y=-5..5, axes=`normal`)"); will be displayed properly.
TIP: Check out Set 2D Maple plot options to create 2D Maple plots.
Available 3D Maple plot options
TIP: Check out MapleTM Online Help for more details on 3D Maple plot options.
| 3D Maple plot option | Default setting (if applicable) | Description |
|---|---|---|
| ambientlight |
Sets the red, green, and blue intensity of the ambient light for user-defined lighting. r, g, and b values must be numeric in the range 0 to 1. | |
| axes | boxed |
Specifies the type of axes. Choose from: boxed, frame, none, or normal. |
| axesfont |
Font for the labels on the tick marks of the axes (specified in the same manner as font). Overrides values specified for font. | |
| axis |
Specifies information about the x -axis, y-axis, and z-axis. axis=t applies the information given in t to all 3 axes. axis[dir]=t allows the information to be specified for a single axis or 2 axes, with dir taking the value 1 ( x -axis), 2 ( y -axis), and 3 (z-axis), or a sequence of 2 of these values. TIP: Check out MapleTM Online Help for more information on axis. | |
| caption | no caption |
The caption printed under the plot (rendered in the image), and the alt-text readable by a screen reader for accessibility purposes. The value c can be a list consisting of the caption text followed by the font option. TIP: Check out MapleTM Online Help for more information on caption. |
| captionfont |
Specifies the font for a plot caption (specified in the same manner as font). Overrides values specified for font. | |
| color |
Specifies the color of the plot. c should be spelled without capital letters. Example — blue, not Blue. NOTE: Color specification takes precedence over shading specification, regardless of the order of the options in the command. TIP: Check out MapleTM Online Help for more information on color. | |
| contours | 10 |
Specifies the number of contours or a list of contour values. n is a positive integer or a list of contour values. |
| coords | Cartesian |
The coordinate system. The value c is a choice from the list of coords. TIP: Check out MapleTM Online Help for more information on coords. |
| filled |
If set to true, the area between the surface and the x-y plane is given a solid color. The value of the filled option can also be a list containing 1 or more sub-options (color, style, or transparency). The options in the list are applied only to the filled area, and not to the original surface itself. NOTE: This option doesn't work with non-Cartesian coordinate systems. | |
| filledregions |
If set to true, the regions defined by the curves on a surface are filled with different colors. Only valid with the following commands: contourplot3d, listcontplot3d, and plot3d with the style=contour option. NOTE: This option doesn't work with non-Cartesian coordinate systems. | |
| font |
Defines the font for the plot title, caption, axis tickmark labels, and axis labels if no values have been specified for the axesfont, captionfont, labelfont, or titlefont options. The value l is a list of the form [family, style, size]. The value of family can be: Times, Courier, Helvetica, or Symbol. TIP: family can also be any font name supported by your system. Example — Tahoma and Lucida in Windows. NOTE: The first letter of the family value must be capitalized. style can be omitted or can be: roman, bold, italic, bolditalic, oblique, or boldoblique. NOTE: The Symbol family doesn't accept a style option. size is the point size to be used. | |
| glossiness | 1 |
Specifies the glossiness of a plotted surface. g controls the amount of light reflected from the surface and must evaluate to a floating-point number in the range 0 to 1. A g value of 0 results in no light reflected, giving the surface a matte or dull finish. A g value of 1 results in maximum reflection, giving a glossy finish. NOTE: Reflections can be rendered only if point light sources are enabled, such as:
|
| grid | [49, 49] |
Specifies the dimensions of a rectangular grid on which the points are generated (equally spaced). NOTE: The value of the grid option may affect the look of the surface wireframe. For more information, see the note under the style option below. NOTE: The surface is rendered using the specified grid option and can affect the look of the surface of the wireframe. When the style option is set to surfacewireframe, a wireframe corresponding to the grid is drawn. Some gridlines may be omitted to avoid a very dense wireframe. |
| gridstyle |
Specifies the grid shape. x can be: rectangular or triangular. NOTE: This option is not available for all 3-D plot objects. Example — gridstyle has no effect on polyhedra created with the plots[polyhedraplot] command or with the plot3d command combined with the filled=true option. | |
| labeldirections | horizontal |
Specifies the direction in which labels are printed along the axes. The values of x, y, and z must be horizontal or vertical. NOTE: The axes option must be set to boxed, frame, or normal. |
| labelfont |
Font for the labels on the axes of the plot (specified in the same manner as font). Overrides values specified for font. | |
| labels | the names of the variables in the original function to be plotted (if available) |
Specifies labels for the axes. If labels aren't specified and there aren't available variable names in the plotted function, no labels are applied. x, y, and z must be a string. |
| light |
Adds a directed light source from the direction of phi, theta in spherical coordinates. Red, green, and blue intensities are given by r, g, and b. r, g, and b must be numeric in the range 0 to 1. | |
| lightmodel | light3 |
Selects a predefined light model to illuminate the plot. Valid light models: none, light1, light2, light3, and light4. NOTE: The value x must be in lowercase. |
| linestyle | solid |
Controls the line style of curves. t can be an integer from 1 to 7, where each integer represents a line style, as given in the order of: (1) solid, (2) dot, (3) dash, (4) dashdot, (5) longdash, (6) spacedash, or (7) spacedot. t can also be the name of an available line styles. Example — dash |
| numpoints | 49 |
Specifies the minimum number of points to be generated for a curve or a surface. NOTE: If numpoints=n option is defined, then the plot3d command uses a rectangular grid of dimension isqrt(n+3)+1. Otherwise, the plot3d command uses the default value for the grid option. |
| orientation | [55, 75, 0] (if the orientation option is not specified) |
Orientation is specified by angles in degrees. psi defines the plot rotation about the x-axis. phi defines the plot rotation (transformation) about the y-axis. theta defines the plot rotation (transformation) about the z-axis. These angles are the Euler angles for the transformation matrix, using the axes specified. The angle psi is optional and is assumed to be 0 if not given. |
| projection | orthogonal |
Specifies the perspective from which the surface is viewed. r is a real number between 0 and 1. 1 results in orthogonal projection. 0 results in wide-angle perspective rendering. r can also be: fisheye(0), normal(0.5), or orthogonal(1). |
| scaling | unconstrained (plot is scaled to fit the window) |
Specifies the scaling of the graph. The constrained value causes all axes to use the same scale. Example — A sphere appears perfectly round. |
| shading | (device-dependent) |
Specifies how the surface is colored. s can be: xy, xyz, z, zgrayscale, zhue, or none. NOTE: The color option takes precedence over the shading option, regardless of the order of the options in the command. |
| size |
Specifies the size of the plot window. You can set the size of the plot window by specifying the number of pixels, a proportion of worksheet width, a ratio (Example — a square), the golden ratio, or a custom ratio. w (width) must be a positive numeric value or the string default. h (height) must be a positive numeric value, or: default, golden, or square. If w or h is a number greater than or equal to 10, it specifies the number of pixels for the width or height. If w or h is default, then the default size (which may be interface-specific) is used. If w is a number less than 10, then the plot window width is w multiplied by the width of the worksheet. NOTE: This form for w is ignored if the plot is part of a plot array. If h is a number less than 10, then the height is h multiplied by the width of the plot window as given by w. If h is square, then this is equivalent to h having the value 1.0. If h is golden, then this is equivalent to h having the value equal to the reciprocal of the golden ratio ( 1/2 + sqrt(5)/2 ). | |
| style | surfacewireframe |
The plot style can be: surface (patchnogrid), surfacewireframe (patch), contour, surfacecontour (patchcontour), wireframe (line), wireframeopaque (hidden), point, or pointline. surface results in a colored surface patch rendering. wireframe produce a wireframe. contour produce contour lines. wireframeopaque produces a wireframe over an opaque surface. point results in a plot of the sample points only. NOTE: The surface is rendered using the specified grid option. When the style option is set to surfacewireframe, a wireframe corresponding to the grid is drawn. Some gridlines may be omitted to avoid a very dense wireframe. |
| symbol | plot device-specific if style=point |
Specifies the symbol to use for plotted points. Choose from: asterisk, box, circle, cross, diagonalcross, diamond, point, solidsphere, or sphere. |
| symbolsize | 10 |
The size (in points) of a symbol used in plotting can be given by a positive integer. NOTE: This doesn't affect symbol=point. |
| thickness | 0 |
Specifies the thickness of lines in the plot. n must be a non-negative number. A value of 0 produces the thinnest line that looks good in most contexts. |
| tickmarks |
m, n, and z specify the tickmark placement for the x-axis, y-axis, and z-axis, respectively. Choose from: an integer specifying the number of tickmarks, a list of values specifying locations, a list of equations each having the form location=label, a name, or a spacing structure. For greater control over the appearance of tickmarks, use the axis option. If the axis option is also provided and contains a tickmarks sub-option, then that option overrides this tickmarks option. TIP: Check out MapleTM Online Help for more information on tickmarks. | |
| title | no title |
The title for the plot. t must be a string or a list consisting of the title followed by the font option. TIP: You can create multi-line titles for standard plots. Use the characters \n to start a new title line. TIP: Check out MapleTM Online Help for more information on title. |
| titlefont |
Font for the title of the plot (specified in the same manner as font). Overrides values specified for font. | |
| transparency |
Specifies the transparency of the plot surface. t must evaluate to a floating-point number in the range 0 to 1. A value of 0 means opaque. A value of 1 means fully transparent. | |
| view | entire surface |
Indicates the minimum and maximum coordinates of the surface to be displayed on the screen. |
| viewpoint |
Allows you to create an animation by varying the viewpoint through a 3-D plot, as if a camera were flying through the plot. v is a name or list of sub-options that defines the camera path. NOTE: If the same option is provided more than once with different values, then the final value specified is generally the setting that's used. TIP: Check out MapleTM Online Help for more information on viewpoint. |
Examples of 3D Maple plots
Here are some examples of using 3D Maple plot options within the plotstatement argument:
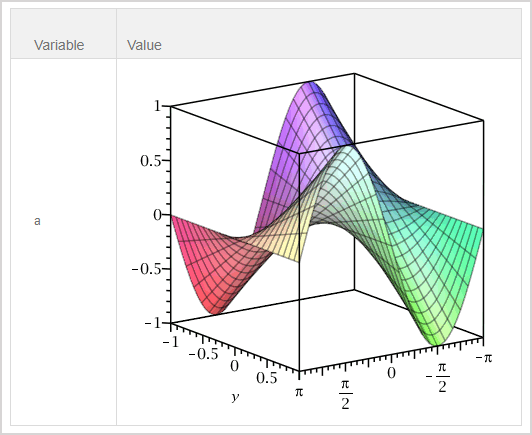
Example 1
Use the following 3D Maple plot options:
- lightmodel = light1
Enter into the Algorithm Editor:
$a=plotmaple("plot3d(sin(x)*y, x=-Pi..Pi, y=-1..1, lightmodel=light1)");
- Returns:
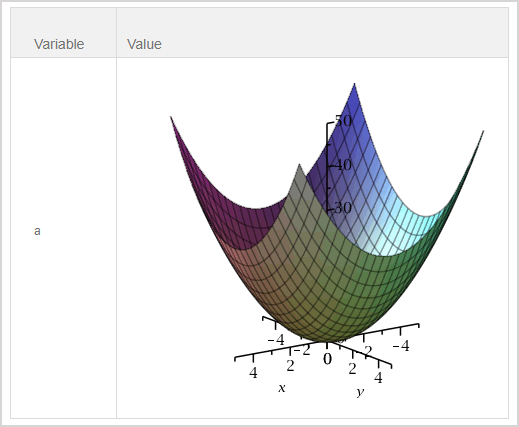
Example 2
Use the following 3D Maple plot options:
- axes = normal
Enter into the Algorithm Editor:
$a=plotmaple("plot3d(x^2+y^2, x=-5..5, y=-5..5, axes=normal)");
- Returns:
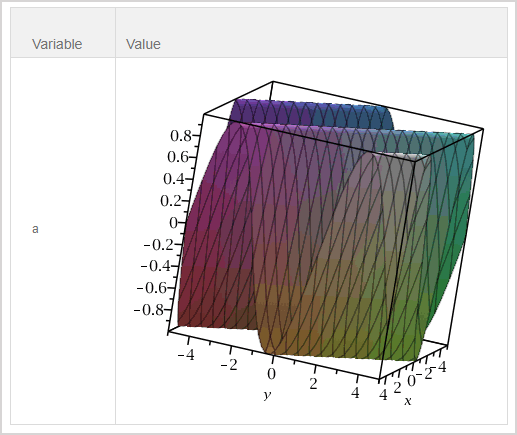
Example 3
Use the following 3D Maple plot options:
- coords = toroidal(10)
- scaling = constrained
- style = contour
Enter into the Algorithm Editor:
$a=plotmaple("plot3d([1, x, y], x = 0 .. 2*Pi, y = 0 .. 2*Pi, coords = toroidal(10), scaling = constrained, style = contour)");
- Returns:

Example 4
Use the following 3D Maple plot options:
- viewpoint = `circleleft`, frames=20
Enter into the Algorithm Editor:
$a=plotmaple("plot3d(sin(x+y), x=-5..5, y=-5..5, viewpoint=`circleleft`, frames=20)");
NOTE: This example has animation using the viewpoint option!
- Returns: