View additional examples of sketch questions
Jump to section
Check out these example sketch questions to help elevate your question authoring:
TIP: Check out these additional help topics for more information on sketch questions:
- Author a sketch question — Reminders of how to work with the Question Editor to author a sketch question.
- Use the Sketch Board toolbar — Details of what each icon of the Sketch Board toolbar does how to use them.
- Customize the student Sketch Board toolbar — Tips on how to control what sketching icons are available to students on their Sketch Board toolbar during their question attempt.
Example: Piecewise functions
Here's how to author a sketch question related to piecewise functions:
NOTE: This example requires the student to graph lines and then use the snipping tools.
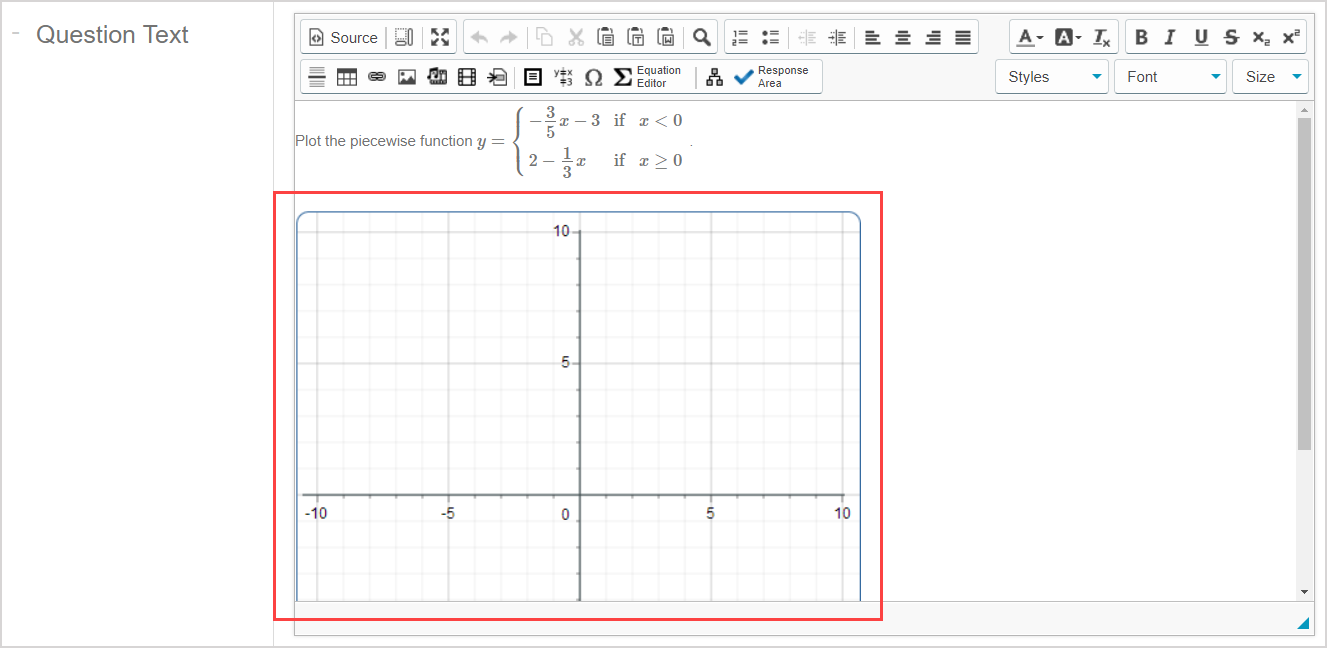
Enter this question statement in the Question Text pane of the Question Editor: Plot the piecewise function
Use the Equation Editor to define this function for the question statement:

Insert a Sketch component and change only the following property:
- Group plots: Yes
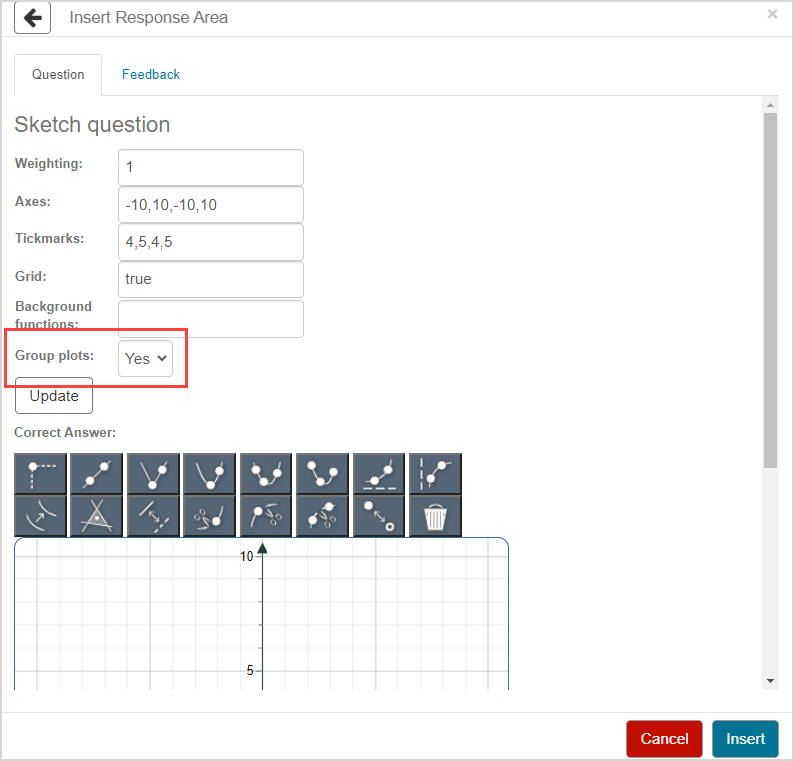
Click Update to update the Sketch Board with your defined properties.

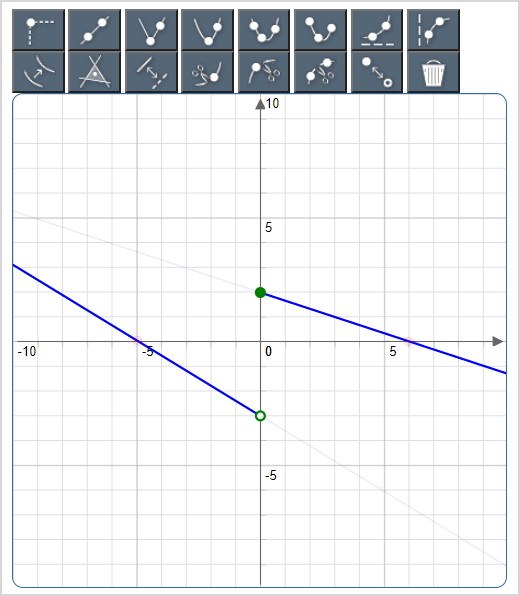
Define the correct answer in the following way:
- 5a. Use the Draw Line
 sketching tool to plot one line with the following points:
- (0, 2) and (6, 0)
- 5b. Use the Draw Line
 sketching tool to plot a second line with the following points:
- (-5, 0) and (0, -3)
- 5c. Use the Snip Left
 sketching tool and click on the point at (0, 2)
 - 5d. Use the Snip Right
 sketching tool and click on the point at (0, -3)
 - 5e. Use the Toggle Filled/Hollow
 sketching tool and click on the point at (0, -3)
Click Insert to insert the student response component into your question.

The sketch component is inserted into your question.
Example: Supply and demand
Here's how to author a sketch question related to supply and demand:
NOTE: This example requires the student to click-and-drag a curve and point on the Sketch Board.
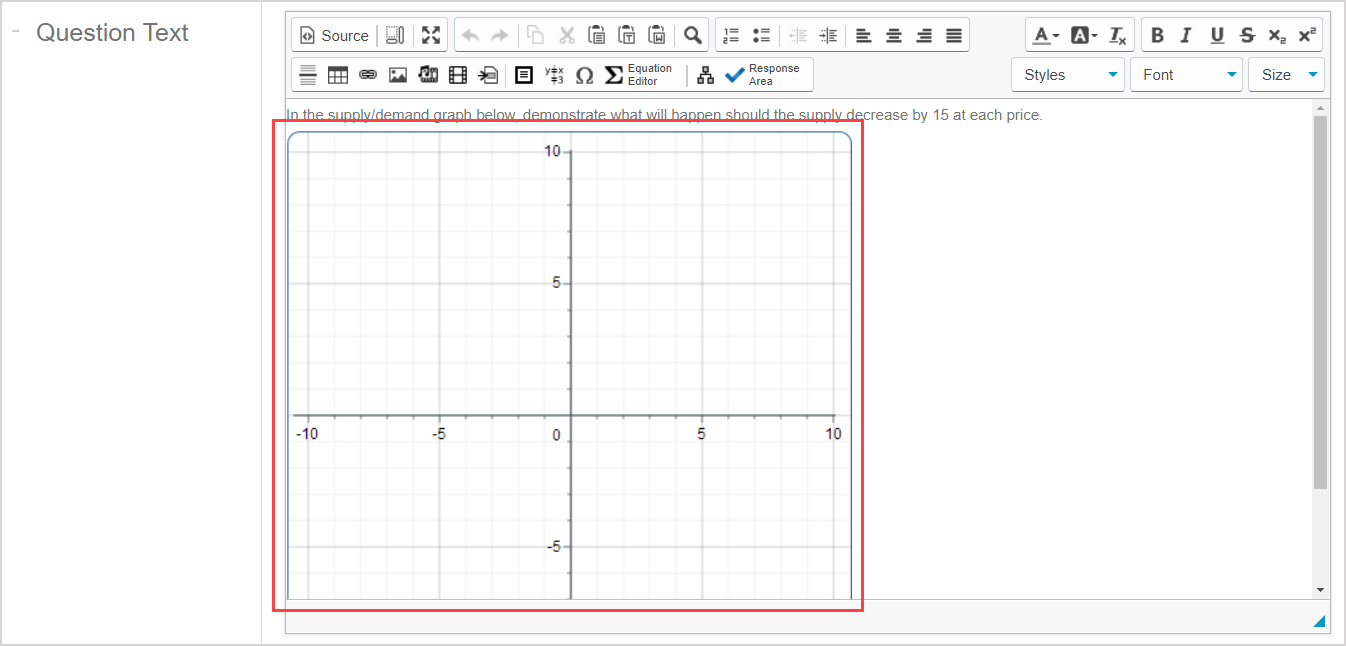
Enter this question statement in the Question Text pane of the Question Editor: In the supply/demand graph below, demonstrate what will happen should the supply decrease by 15 at each price.
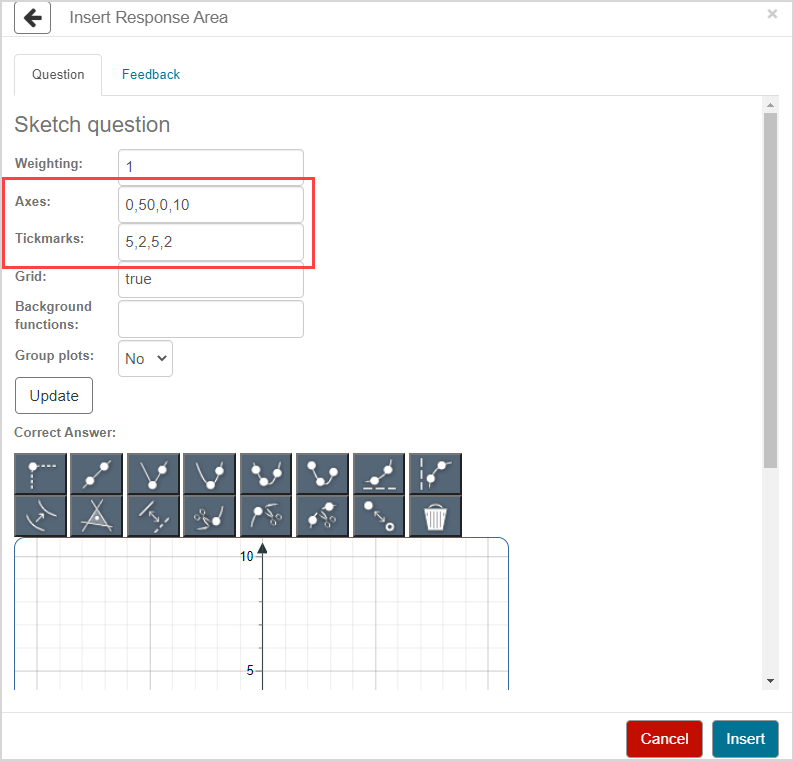
Insert a Sketch component and change the following properties:
- Axes: 0, 50 ,0, 10
- Tickmarks: 5, 2, 5, 2
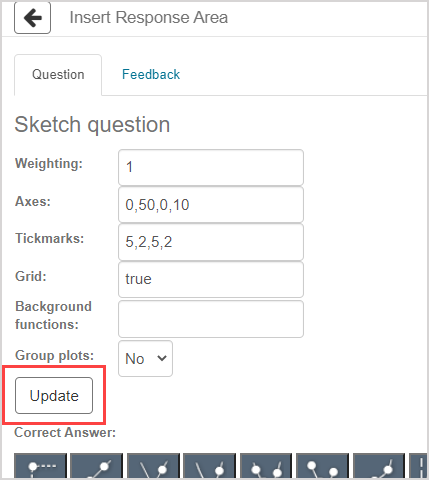
Click Update to update the Sketch Board with your defined properties.
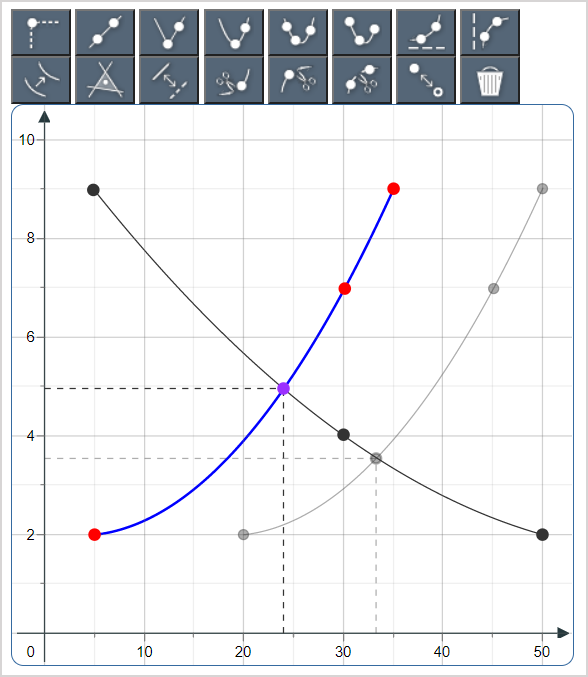
Define the correct answer in the following way:
- 4a. Use the Draw Three-Point Parabola Segment
 sketching tool to plot one curve with the following points:
- (5, 9), (30, 4), and (50, 2)
- 4b. Use the Switch Pre-Drawn
 sketching tool and select the curve you just plotted in 4a to make it a background curve
 - 4c. Use the Draw Three-Point Parabola Segment
 sketching tool to plot a second curve with the following points:
- (20, 2), (45, 7), and (50, 9)
- 4d. Use the Switch Pre-Drawn
 sketching tool and click-and-drag the curve you just plotted in 4c so that the curve now rests at the following points:
- (5, 2), (30, 7), and (35, 9)
- 4e. Deselect the Switch Pre-Drawn
 sketching tool
 - 4f. Use the Plot Dropline Point
 sketching tool to plot the following point (where the first two original curves from 4a and 4c overlap):
- Approximately (33, 3.5)
- 4g. Use the Switch Pre-Drawn
 sketching tool and click-and-drag the point you just plotted in 4f so that the point now rests where the original curve and relocated curve overlap):
- Approximately (24, 4.95)
TIP: Hovering your cursor over a plotted point reveals its plot coordinates to two decimal places to support you in the relocation of your plotted curves and points.
Click Insert to add the student response component to your question.

The sketch component is inserted into your question.
Example: Transformations of functions
Here's how to author a sketch question related to transformations of functions:
NOTE: This example requires the student to use a background curve to reference for their plotted response.
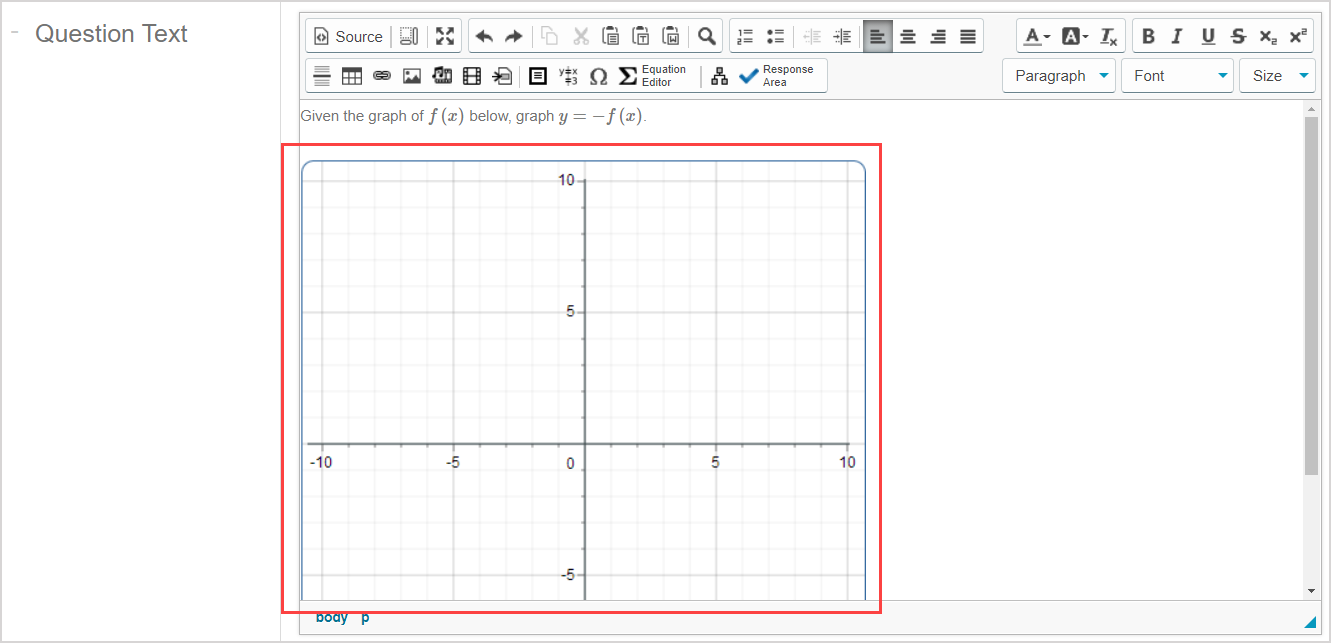
Enter this question statement in the Question Text pane of the Question Editor: Given the graph of below, graph .
Use the Equation Editor to define the two functions and insert them on either side of "below, graph" in the question statement from step 1:

TIP: A represents the first function in the question statement and B represents the second function in the question statement. Your final question statement will look like this:

Insert a Sketch component and insert the following background function:
- Background functions: Math.pow(x+1,2)-3
NOTE: A background function is a pre-drawn curve that's defined using JavaScript syntax. Check out step 8 of the Author a sketch question help topic for more details on how to include a background function.
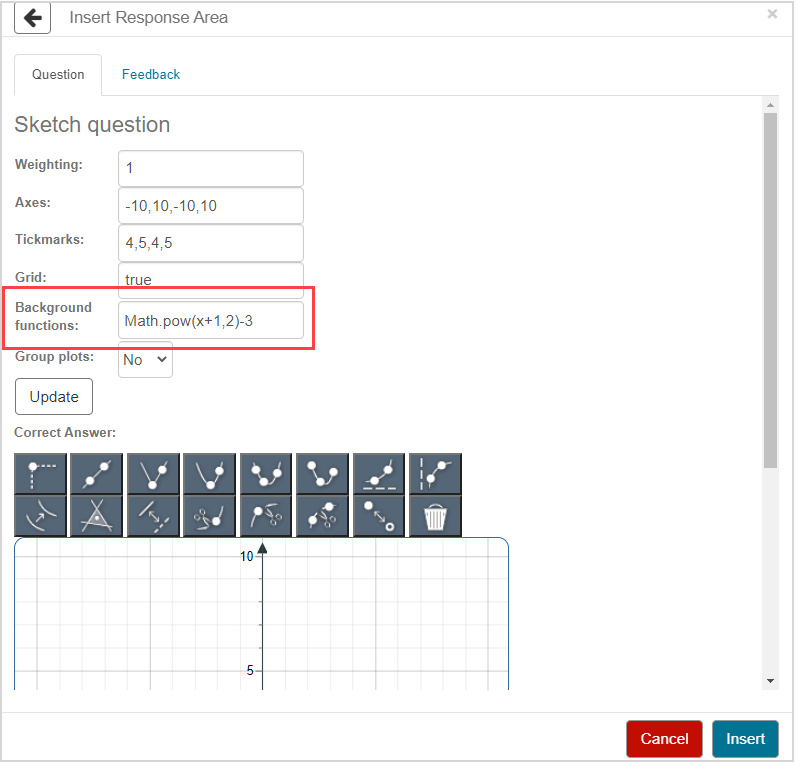
Click Update to update the Sketch Board with your defined properties.

Define the correct answer in the following way:
- Use the Draw Vertex-Point Parabola
 sketching tool to plot a curve line with the following points:
- (-1, 3) and (0, 2)
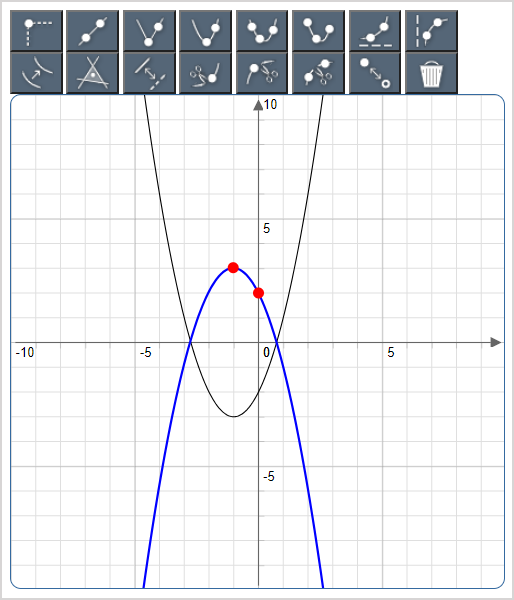
Click Insert to add the student response component into your question.

The sketch component is inserted into your question.
Example: Inequalities
Here's how to author a sketch question related to inequalities:
NOTE: This example requires the student to select a region on the Sketch Board.
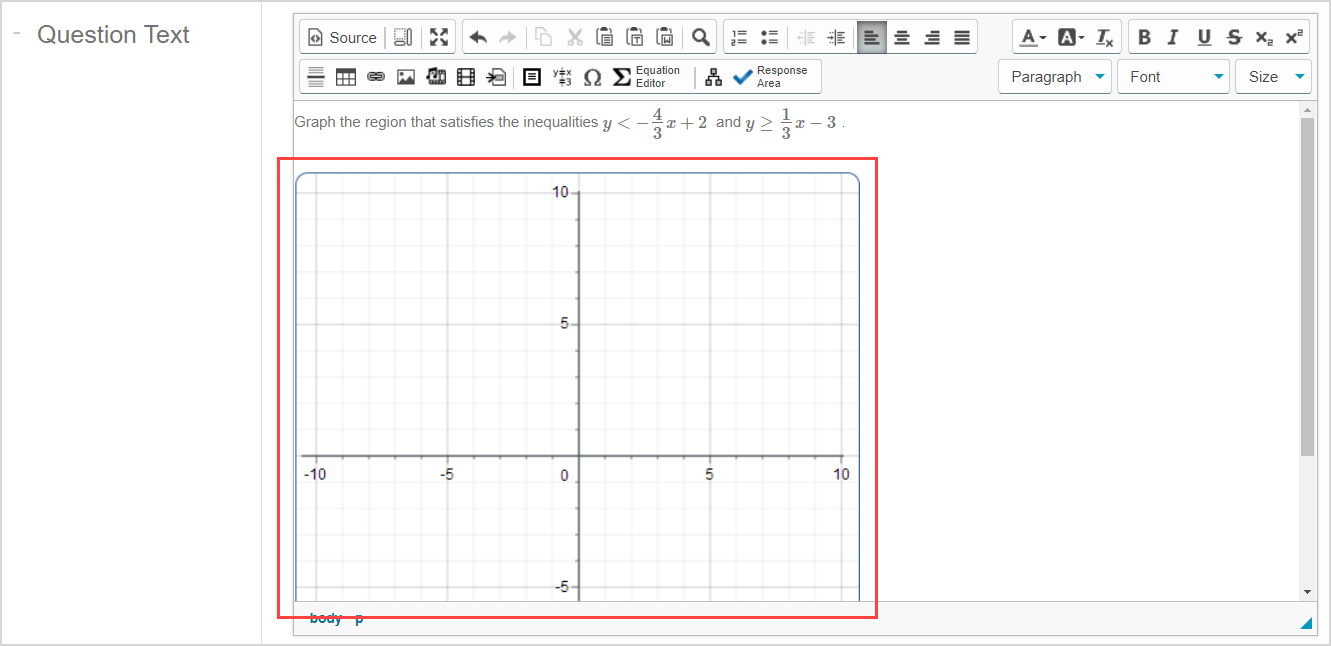
Enter this question statement in the Question Text pane of the Question Editor: Graph the region that satisfies the inequalities and .
Use the Equation Editor to define two different inequalities and insert them on either side of "and" in the question statement from step 1:
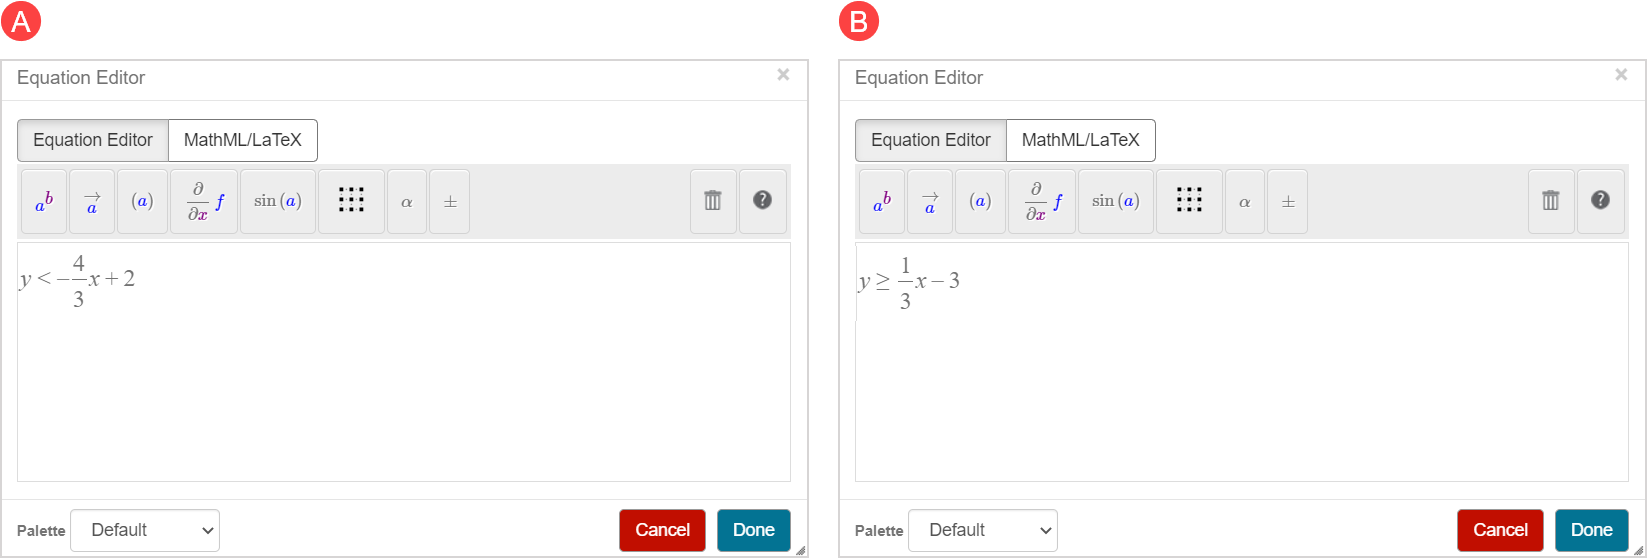
TIP: A represents the first inequality in the question statement and B represents the second inequality in the question statement. Your final question statement will look like this:

Insert a Sketch component using the default student response component properties.
Define the correct answer in the following way:
- 4a. Use the Draw Line
 sketching tool to plot a line with the following points:
- (0, 2) and (3, -2)
- 4b. Click the Toggle Solid/Dashed
 sketching tool and select the line you just plotted in 4a to make it dashed
 - 4c. Use the Draw Line
 sketching tool to plot a second line with the following points:
- (0, -3) and (3, -2)
- 4d. Click the Choose Region
 sketching tool and select the region created by the two lines that mostly overlays the negative x-axis
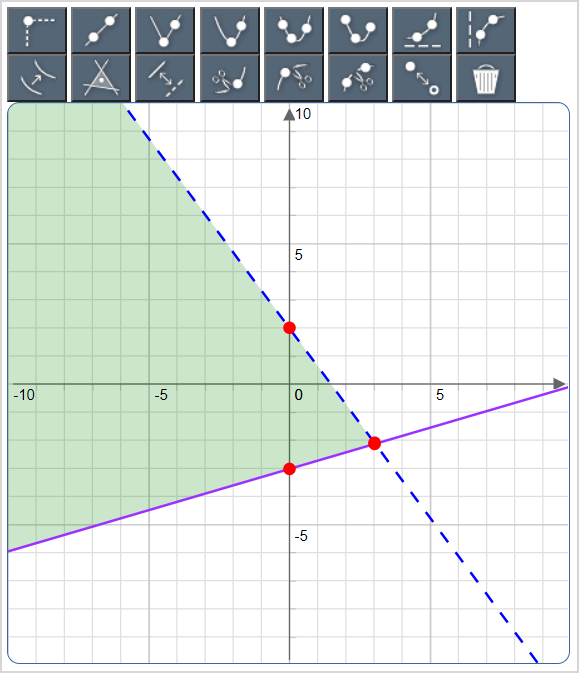
Click Insert to add the student response component into your question.

The sketch component is inserted into your question.
