Description

The Introductory Statistics Content Pack is an entire OpenStax textbook that you can use as a customizable starting point to a complete statistics course in Möbius. While following scope and sequence requirements of a one-semester introductory statistics course, this material assumes some knowledge of intermediate algebra and is geared towards students majoring in fields other than mathematics or engineering. This Content Pack focuses on statistics application over theory and includes: innovative practical applications that make the text relevant and accessible, collaborative exercises, technology integration problems, and statistics labs with randomization algorithms. This customizable resource includes all traditional OpenStax features such as chapter introductions, sections, review material, and practice tests, and has been enhanced with Möbius capabilities including algorithmic questions, in-lesson questions with unlimited practice, helpful hints, and immediate feedback.

How does Möbius take OpenStax to the next level?

Course Structure

  • All content is organized into 16 units for easy navigation
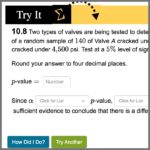
  • Course materials provide a solid foundation for creating your course offering which include 141 lessons with illustrative visualizations, unlimited practice, helpful hints, and immediate feedback to promote Active Learning
  • Different forms of assessment materials are distributed across 13 assignments to evaluate student comprehension through a variety of different question types
  • Pull from a vast selection of over 450 questions that you can use to create your own lessons and assignments or supplement existing ones
16 units
141 lessons
13 assignments
450+ questions

Introductory Materials

Unit 1: Sampling Data

  • 1.1 Definitions of Statistics, Probability, and Key Terms

  • 1.2 Data, Sampling, and Variation in Data and Sampling

  • 1.3 Frequency, Frequency Tables, and Levels of Measurement

  • 1.4 Experimental Design and Ethics

  • 1.5 Data Collection Experiment

  • 1.6 Sampling Experiment

Unit 2: Descriptive Statistics

  • 2.1 Stem-and-Leaf Graphs (Stemplots), Line Graphs, and Bar Graphs

  • 2.2 Histograms, Frequency Polygons, and Time Series Graphs

  • 2.3 Measures of the Location of the Data

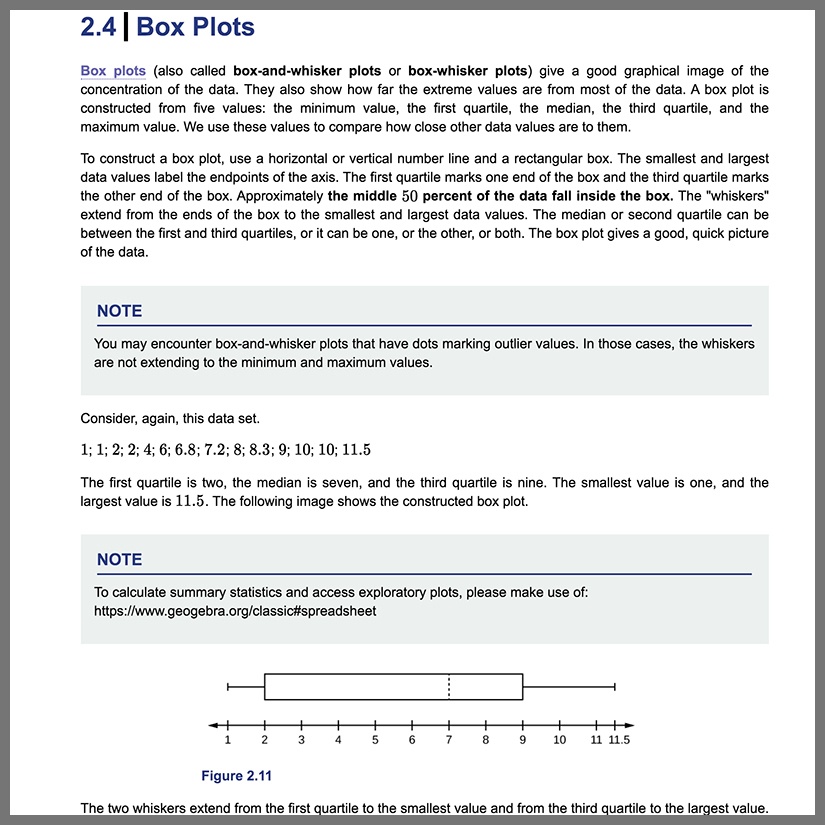
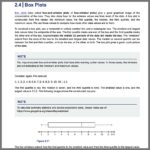
  • 2.4 Box Plots

  • 2.5 Measures of the Center of the Data

  • 2.6 Skewness and the Mean, Median, and Mode

  • 2.7 Measures of the Spread of the Data

  • 2.8 Descriptive Statistics

Unit 3: Probability Topics

  • 3.1 Terminology

  • 3.2 Independent and Mutually Exclusive Events

  • 3.3 Two Basic Rules of Probability

  • 3.4 Contingency Tables

  • 3.5 Tree and Venn Diagrams

  • 3.6 Probability Topics

Unit 4: Discrete Random Variables

  • 4.1 Probability Distribution Function (PDF) for a Discrete Random Variable

  • 4.2 Mean or Expected Value and Standard Deviation

  • 4.3 Binomial Distribution

  • 4.4 Geometric Distribution

  • 4.5 Hypergeometric Distribution

  • 4.6 Poisson Distribution

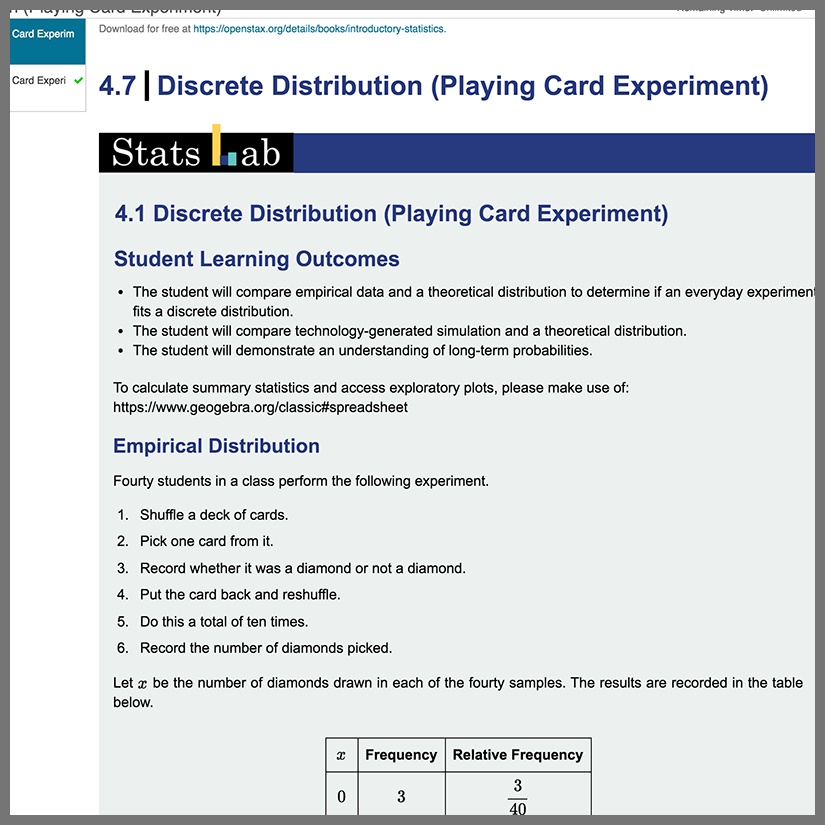
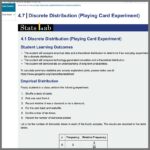
  • 4.7 Discrete Distribution (Playing Card Experiment)

  • 4.8 Discrete Distribution (Lucky Dice Experiment)

Unit 5: Continuous Random Variables

  • 5.1 Continuous Probability Functions

  • 5.2 The Uniform Distribution

  • 5.3 The Exponential Distribution

  • 5.4 Continuous Distribution

Unit 6: The Normal Distribution

  • 6.1 The Standard Normal Distribution

  • 6.2 Using the Normal Distribution

  • 6.3 Normal Distribution (Lap Times)

  • 6.4 Normal Distribution (Pinkie Length)

Unit 7: The Central Limit Theorem

  • 7.1 The Central Limit Theorem for Sample Means (Averages)

  • 7.2 The Central Limit Theorem for Sums

  • 7.3 Using the Central Limit Theorem

  • 7.4 Central Limit Theorem (Pocket Change)

  • 7.5 Central Limit Theorem (Cookie Recipes)

Unit 8: Confidence Intervals

  • 8.1 A Single Population Mean using the Normal Distribution

  • 8.2 A Single Population Mean using the Student t Distribution

  • 8.3 A Population Proportion

  • 8.4 Confidence Interval (Home Costs)

  • 8.5 Confidence Interval (Place of Birth)

  • 8.6 Confidence Interval (Women's Heights)

Unit 9: Hypothesis Testing with One Sample

  • 9.1 Null and Alternative Hypotheses

  • 9.2 Outcomes and the Type I and Type II Errors

  • 9.3 Distribution Needed for Hypothesis Testing

  • 9.4 Rare Events, the Sample, Decision and Conclusion

  • 9.5 Additional Information and Full Hypothesis Test Examples

  • 9.6 Hypothesis Testing of a Single Mean and Single Proportion

Unit 10: Hypothesis Testing with Two Samples

  • 10.1 Two Population Means with Unknown Standard Deviations

  • 10.2 Two Population Means with Known Standard Deviations

  • 10.3 Comparing Two Independent Population Proportions

  • 10.4 Matched or Paired Samples

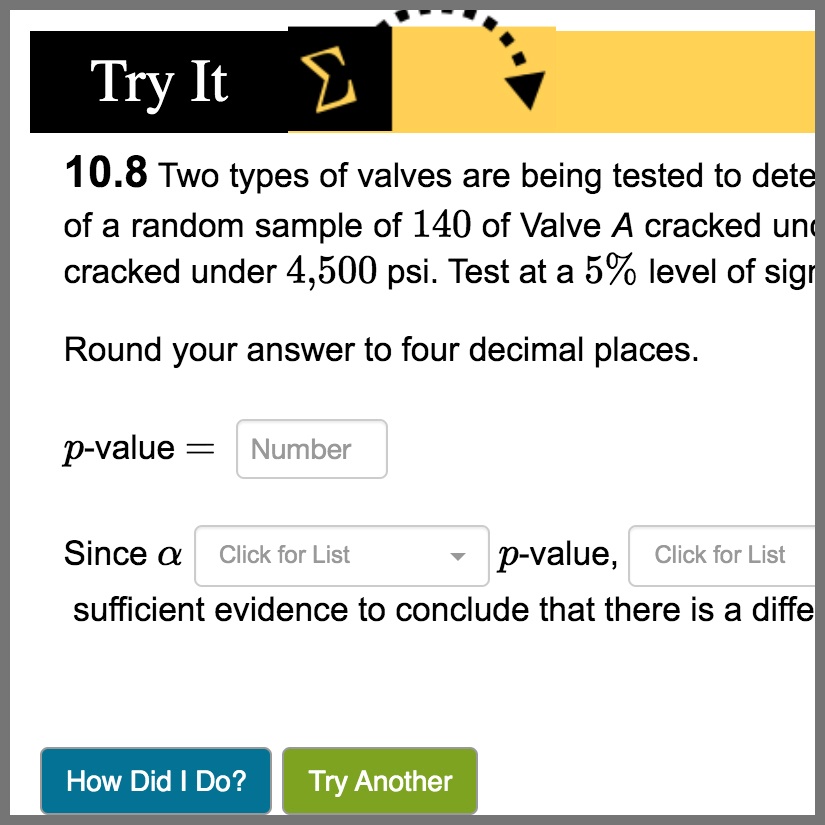
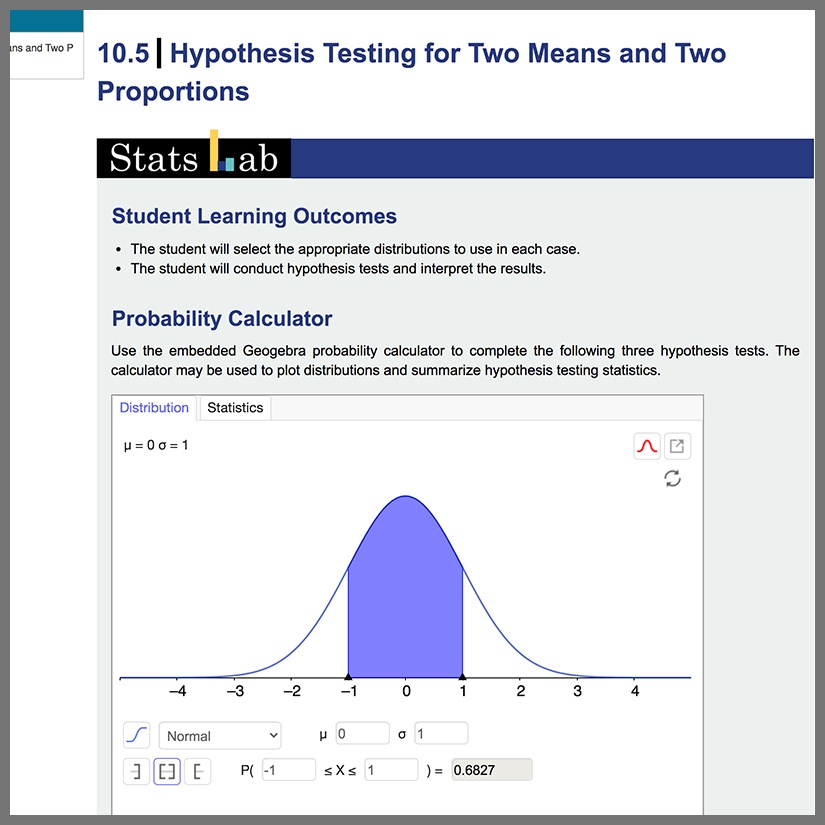
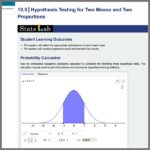
  • 10.5 Hypothesis Testing for Two Means and Two Proportions

Unit 11: The Chi-Square Distribution

  • 11.1 Facts About the Chi-Square Distribution

  • 11.2 Goodness-of-Fit Test

  • 11.3 Test of Independence

  • 11.4 Test for Homogeneity

  • 11.5 Comparison of the Chi-Square Tests

  • 11.6 Test of a Single Variance

  • 11.7 Lab 1: Chi-Square Goodness-of-Fit

  • 11.8 Lab 2: Chi-Square Test of Independence

Unit 12: Linear Regression and Correlation

  • 12.1 Linear Equations

  • 12.2 Scatter Plots

  • 12.3 The Regression Equation

  • 12.4 Testing the Significance of the Correlation Coefficient

  • 12.5 Prediction

  • 12.6 Outliers

  • 12.7 Regression (Distance from School)

  • 12.8 Regression (Textbook Cost)

  • 12.9 Regression (Fuel Efficiency)

Unit 13: F Distribution and One-Way ANOVA

  • 13.1 One-Way ANOVA

  • 13.2 The F Distribution and the F-Ratio

  • 13.3 Facts About the F Distribution

  • 13.4 Test of Two Variances

  • 13.5 Lab: One-Way ANOVA

Assignments

Appendices

Back to Menu

Want a closer look at this Content Pack?

Our Möbius experts can show you the capabilities of any of our Content Packs. During this complimentary, customized demonstration, you’ll discover how Möbius can elevate your online course delivery for STEM subjects.

Contact us to Learn More
DigitalEd